Uses dplyr operations to aggregate data and then `ggplot2` to create a line plot. Because of this approach, the calculations automatically run inside the database if `data` has a database or sparklyr connection. The `class()` of such tables in R are: tbl_sql, tbl_dbi, tbl_spark
If multiple named aggregations are passed, `dbplot` will only use one SQL query to perform all of the operations. The purpose is to increase efficiency, and only make one "trip" to the database in order to obtains multiple, related, plots.
Usage
dbplot_line(data, x, ..., y = n())Value
A ggplot object with a line plot. If multiple aggregations are provided, returns a list of ggplot objects, one for each aggregation.
Examples
# \dontrun{
library(DBI)
library(dplyr)
library(ggplot2)
con <- dbConnect(duckdb::duckdb(), ":memory:")
db_mtcars <- copy_to(con, mtcars, "mtcars")
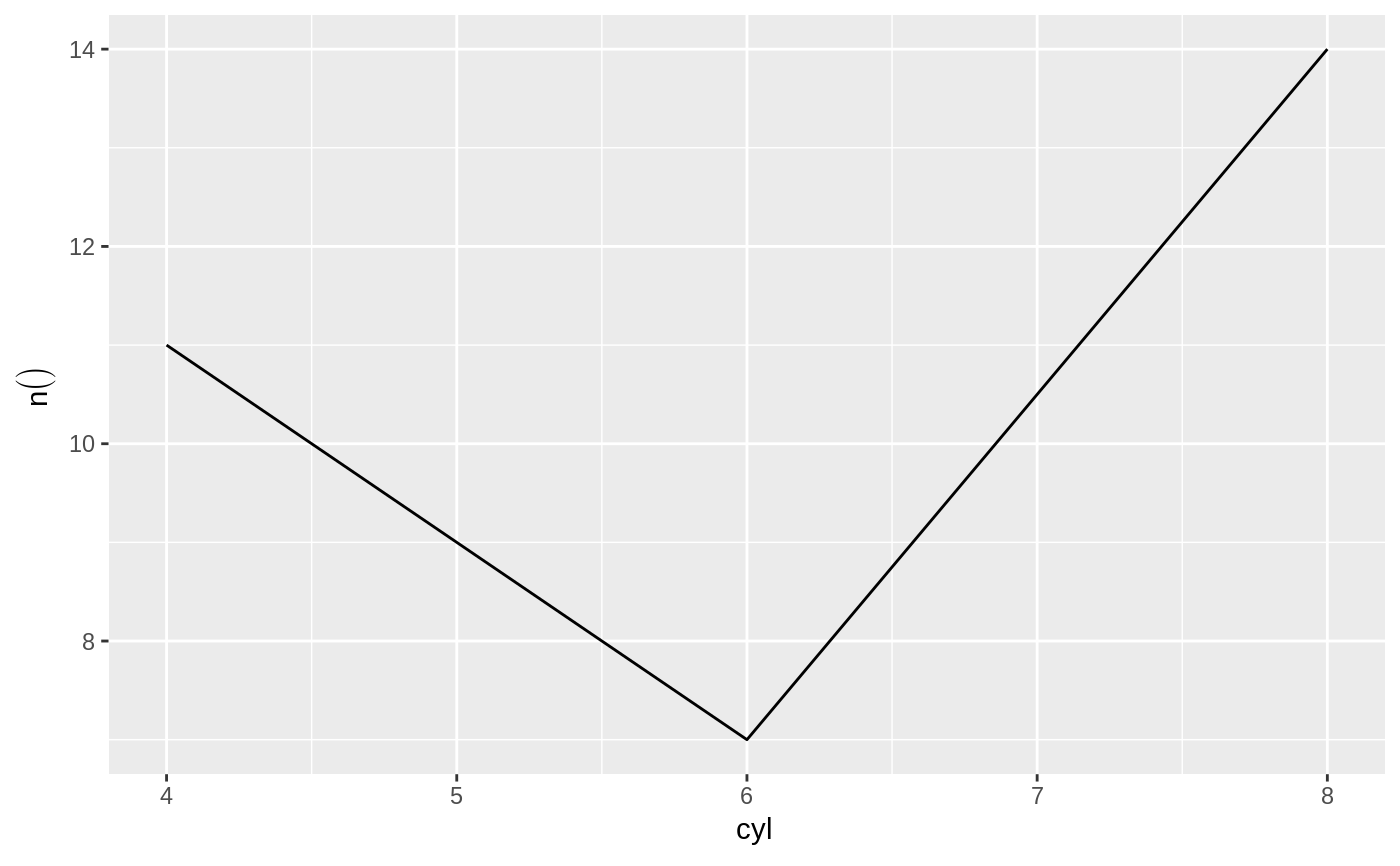
# Returns a plot of the row count per cyl
db_mtcars |>
dbplot_line(cyl)
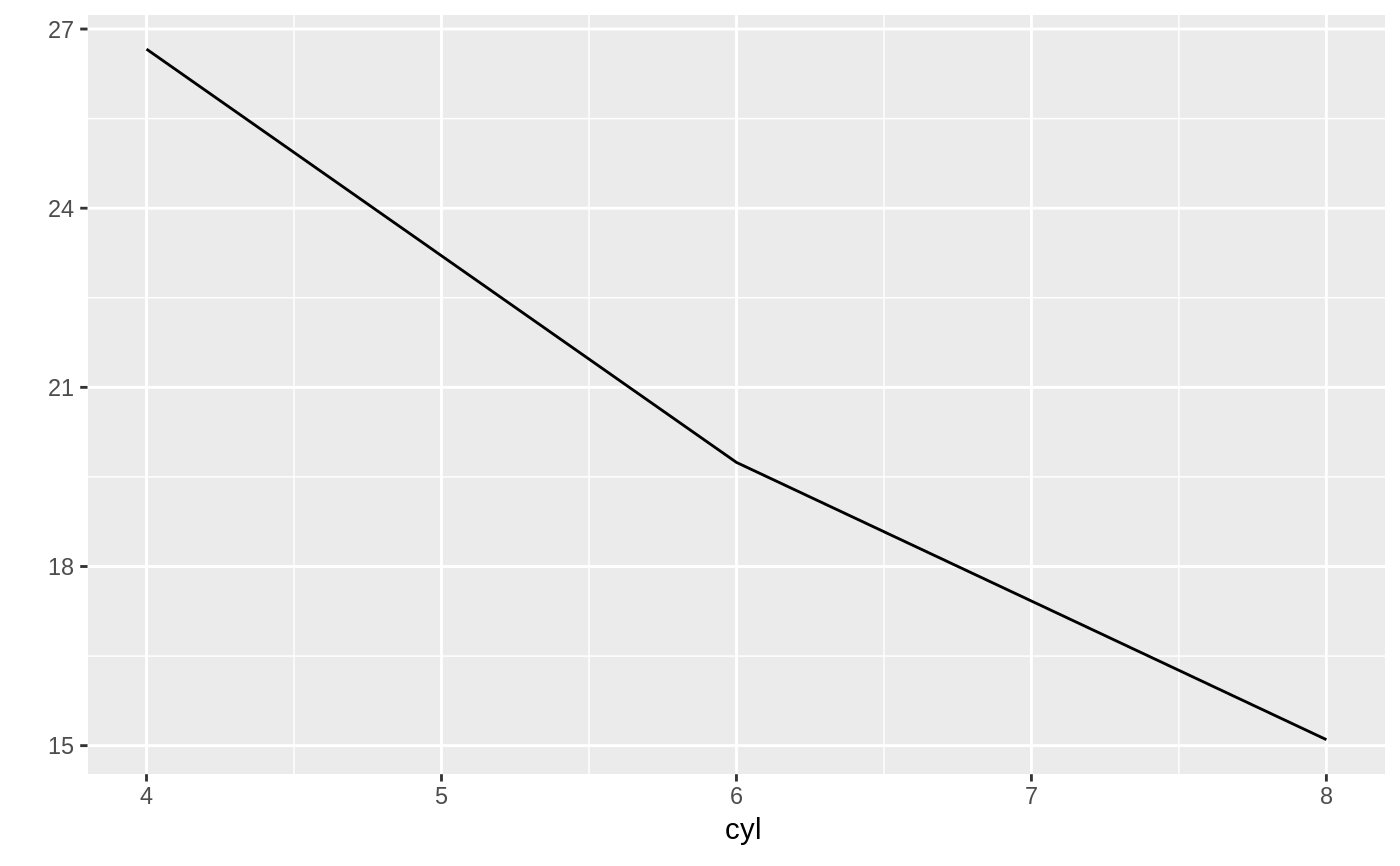
 # Returns a plot of the average mpg per cyl
db_mtcars |>
dbplot_line(cyl, mean(mpg))
# Returns a plot of the average mpg per cyl
db_mtcars |>
dbplot_line(cyl, mean(mpg))
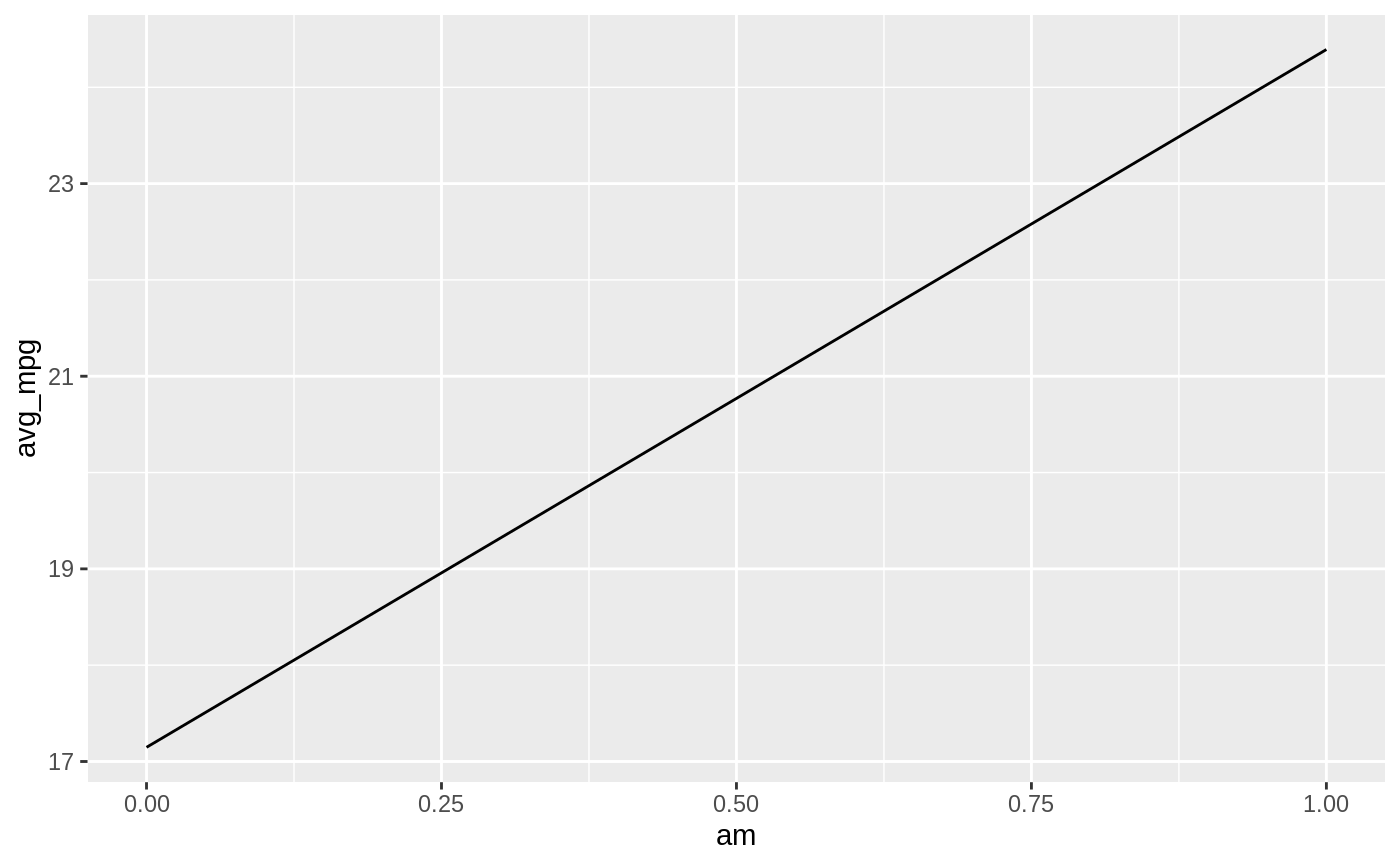
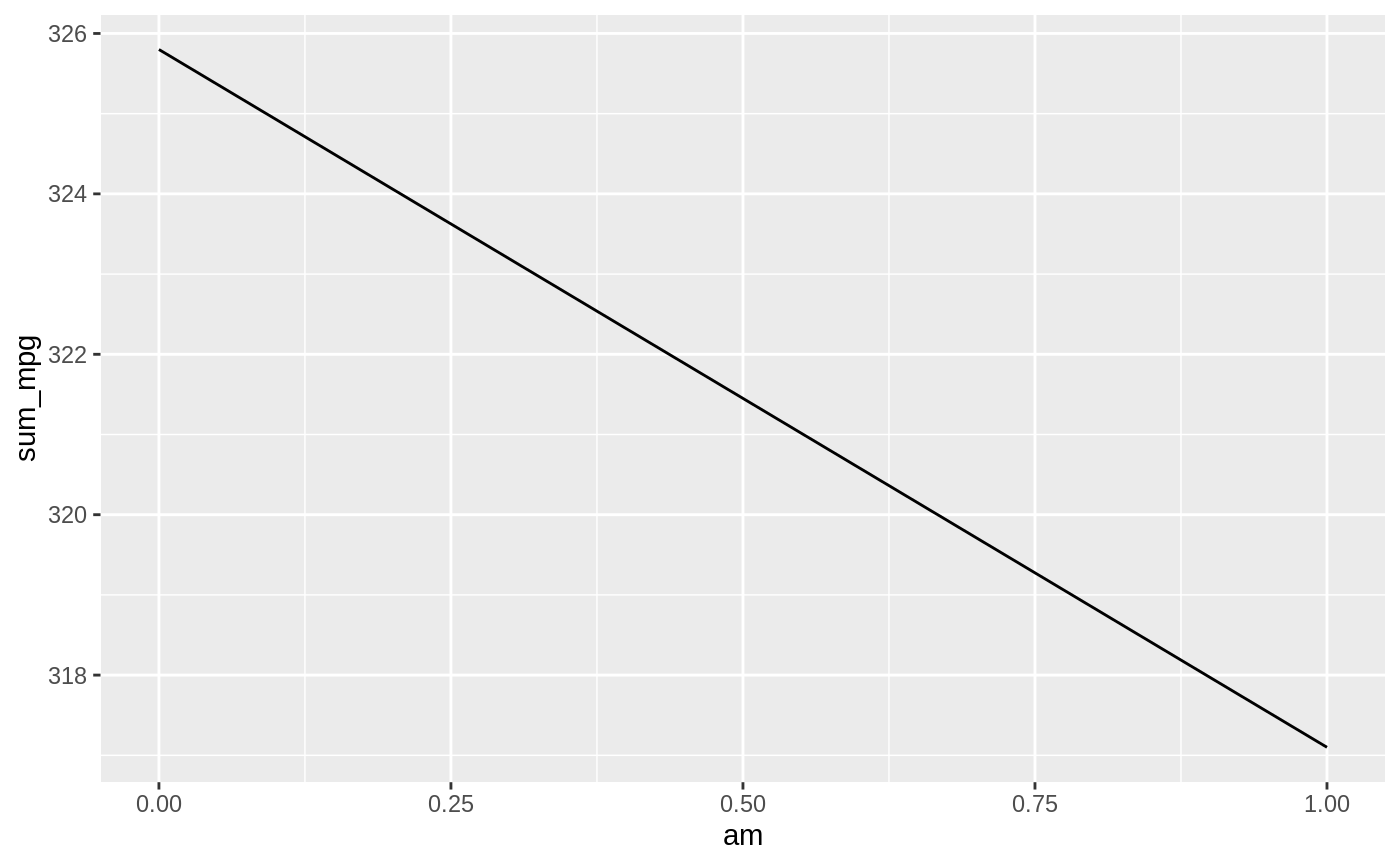
 # Returns the average and sum of mpg per am
db_mtcars |>
dbplot_line(am, avg_mpg = mean(mpg), sum_mpg = sum(mpg))
#> $avg_mpg
# Returns the average and sum of mpg per am
db_mtcars |>
dbplot_line(am, avg_mpg = mean(mpg), sum_mpg = sum(mpg))
#> $avg_mpg
 #>
#> $sum_mpg
#>
#> $sum_mpg
 #>
dbDisconnect(con)
# }
#>
dbDisconnect(con)
# }