Uses dplyr operations to aggregate data and then `ggplot2` to create the histogram. Because of this approach, the calculations automatically run inside the database if `data` has a database or sparklyr connection. The `class()` of such tables in R are: tbl_sql, tbl_dbi, tbl_spark
Examples
# \dontrun{
library(DBI)
library(dplyr)
library(ggplot2)
con <- dbConnect(duckdb::duckdb(), ":memory:")
db_mtcars <- copy_to(con, mtcars, "mtcars")
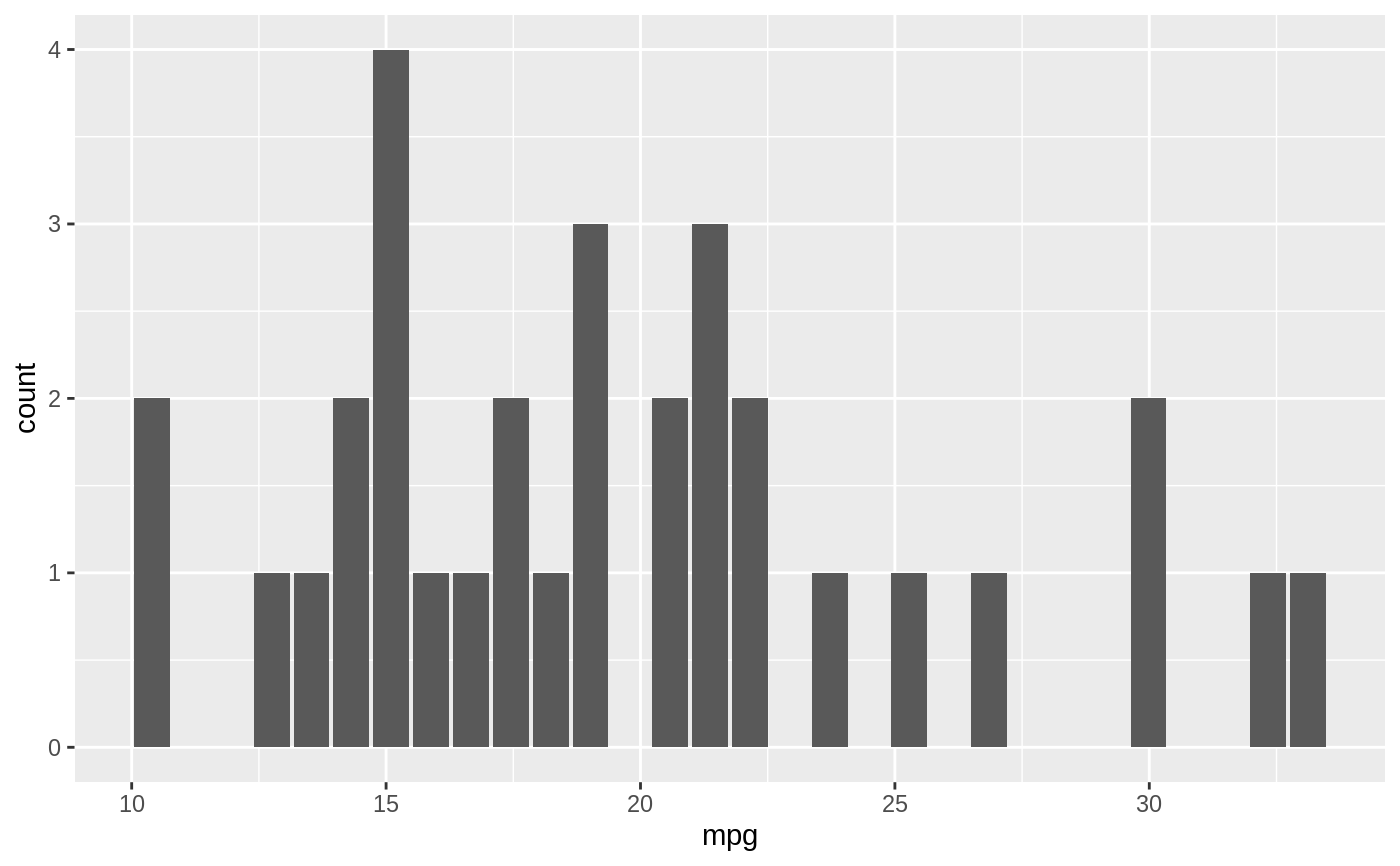
# A ggplot histogram with 30 bins
db_mtcars |>
dbplot_histogram(mpg)
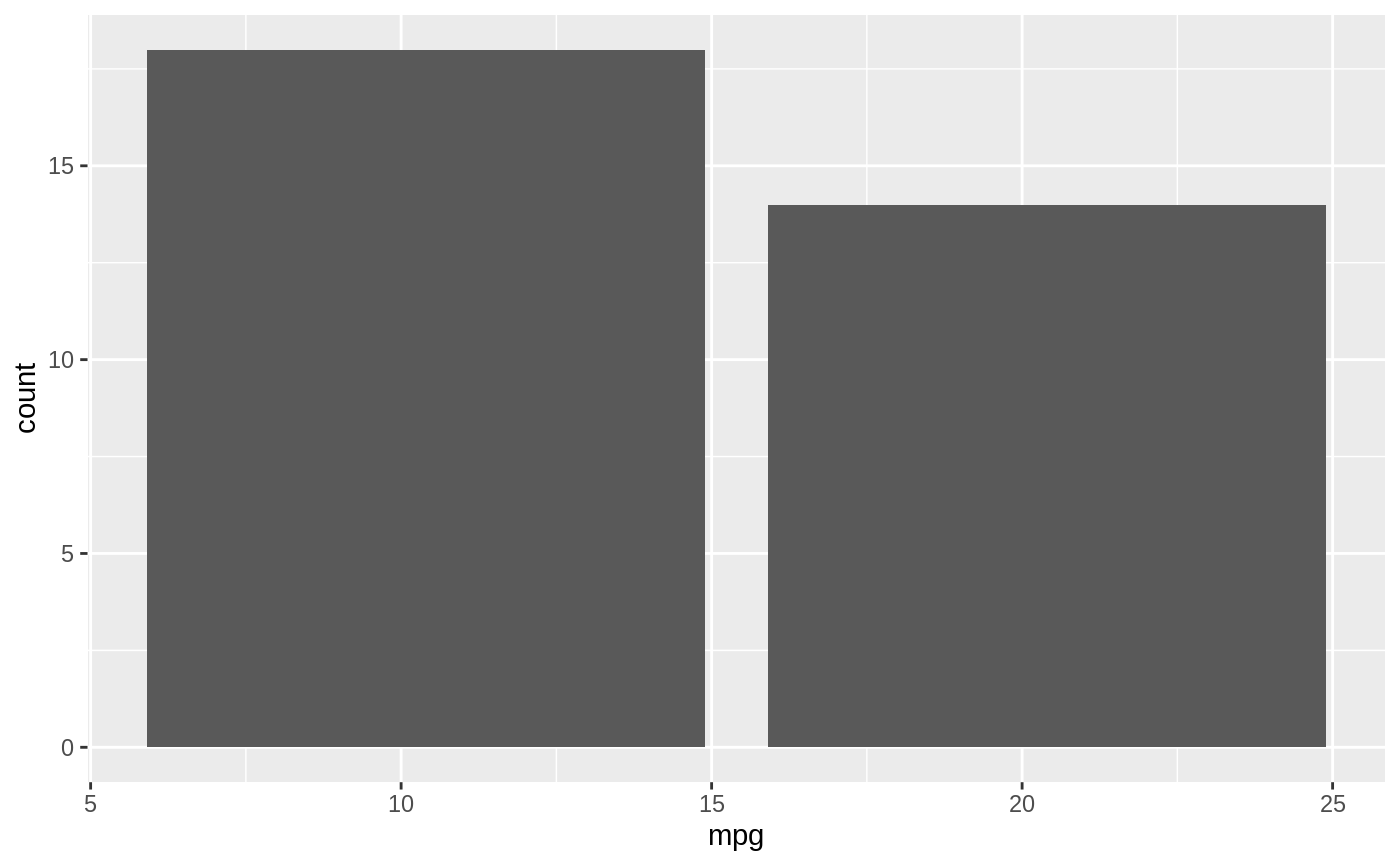
 # A ggplot histogram with bins of size 10
db_mtcars |>
dbplot_histogram(mpg, binwidth = 10)
# A ggplot histogram with bins of size 10
db_mtcars |>
dbplot_histogram(mpg, binwidth = 10)
 dbDisconnect(con)
# }
dbDisconnect(con)
# }