Uses dplyr operations to aggregate data and then `ggplot2` to create the plot. Because of this approach, the calculations automatically run inside the database if `data` has a database or sparklyr connection. The `class()` of such tables in R are: tbl_sql, tbl_dbi, tbl_spark
Usage
dbplot_bar(data, x, ..., y = n())Value
A ggplot object with a bar plot. If multiple aggregations are provided, returns a list of ggplot objects, one for each aggregation.
Examples
# \dontrun{
library(DBI)
library(dplyr)
library(ggplot2)
con <- dbConnect(duckdb::duckdb(), ":memory:")
db_mtcars <- copy_to(con, mtcars, "mtcars")
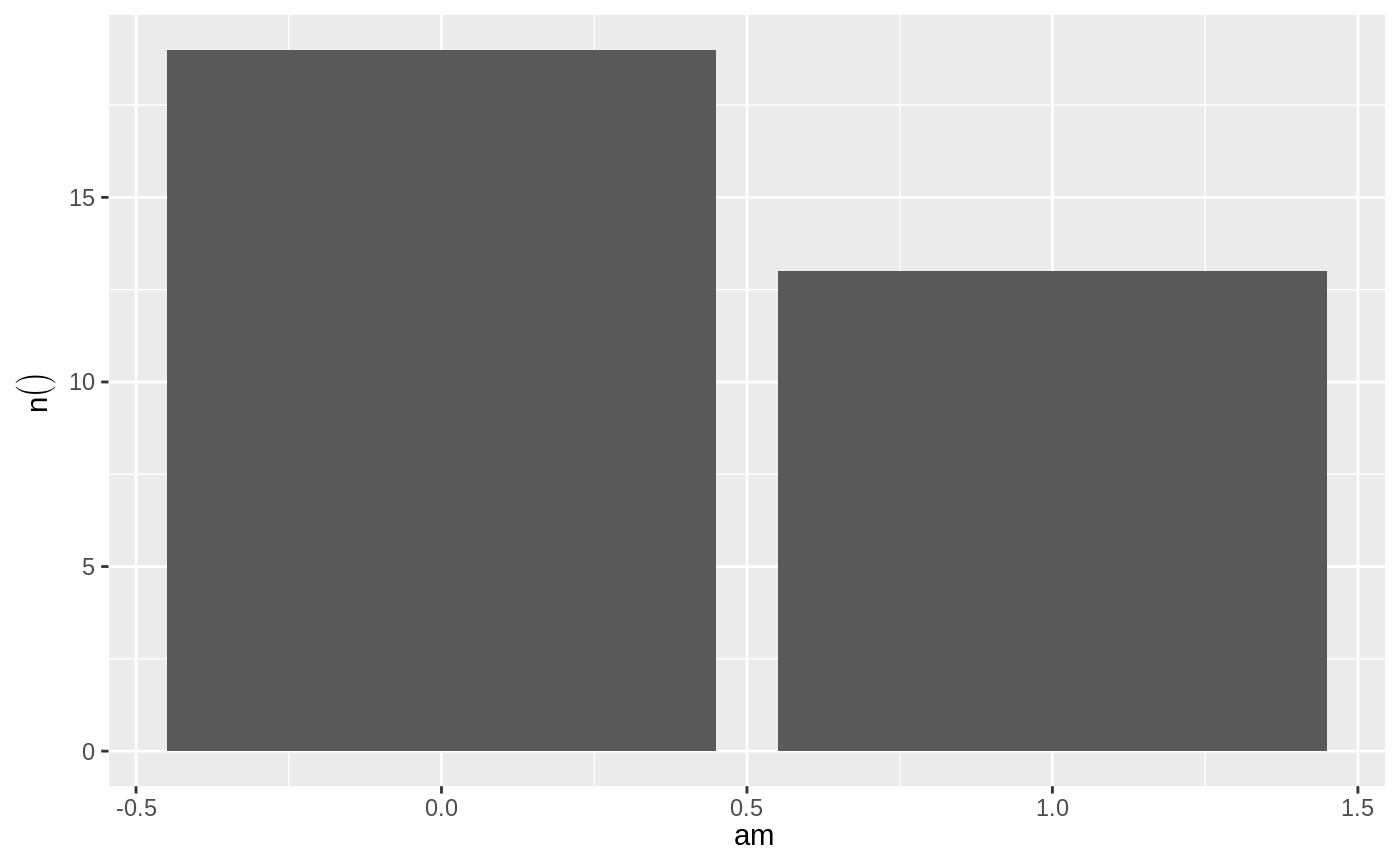
# Returns a plot of the row count per am
db_mtcars |>
dbplot_bar(am)
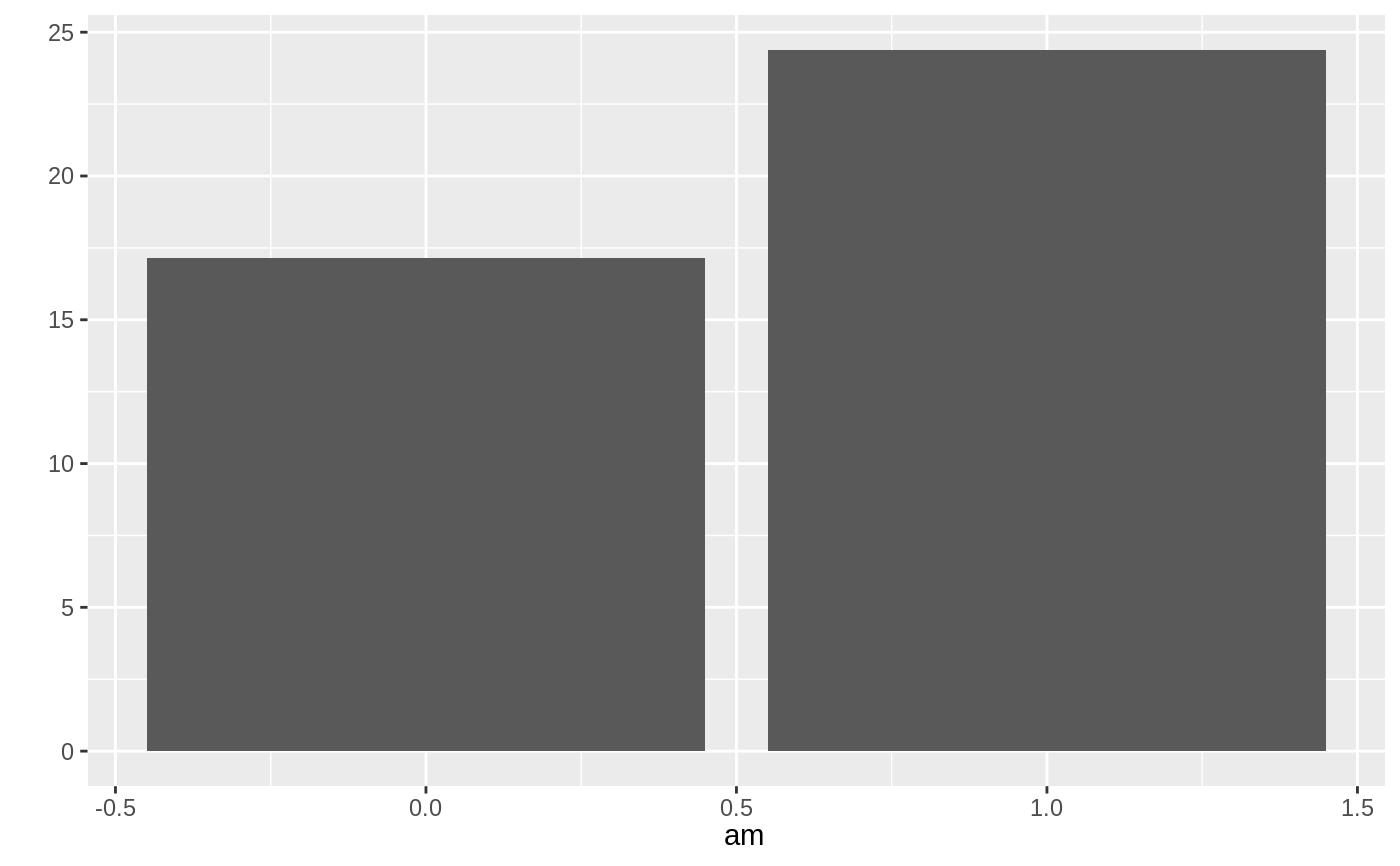
 # Returns a plot of the average mpg per am
db_mtcars |>
dbplot_bar(am, mean(mpg))
# Returns a plot of the average mpg per am
db_mtcars |>
dbplot_bar(am, mean(mpg))
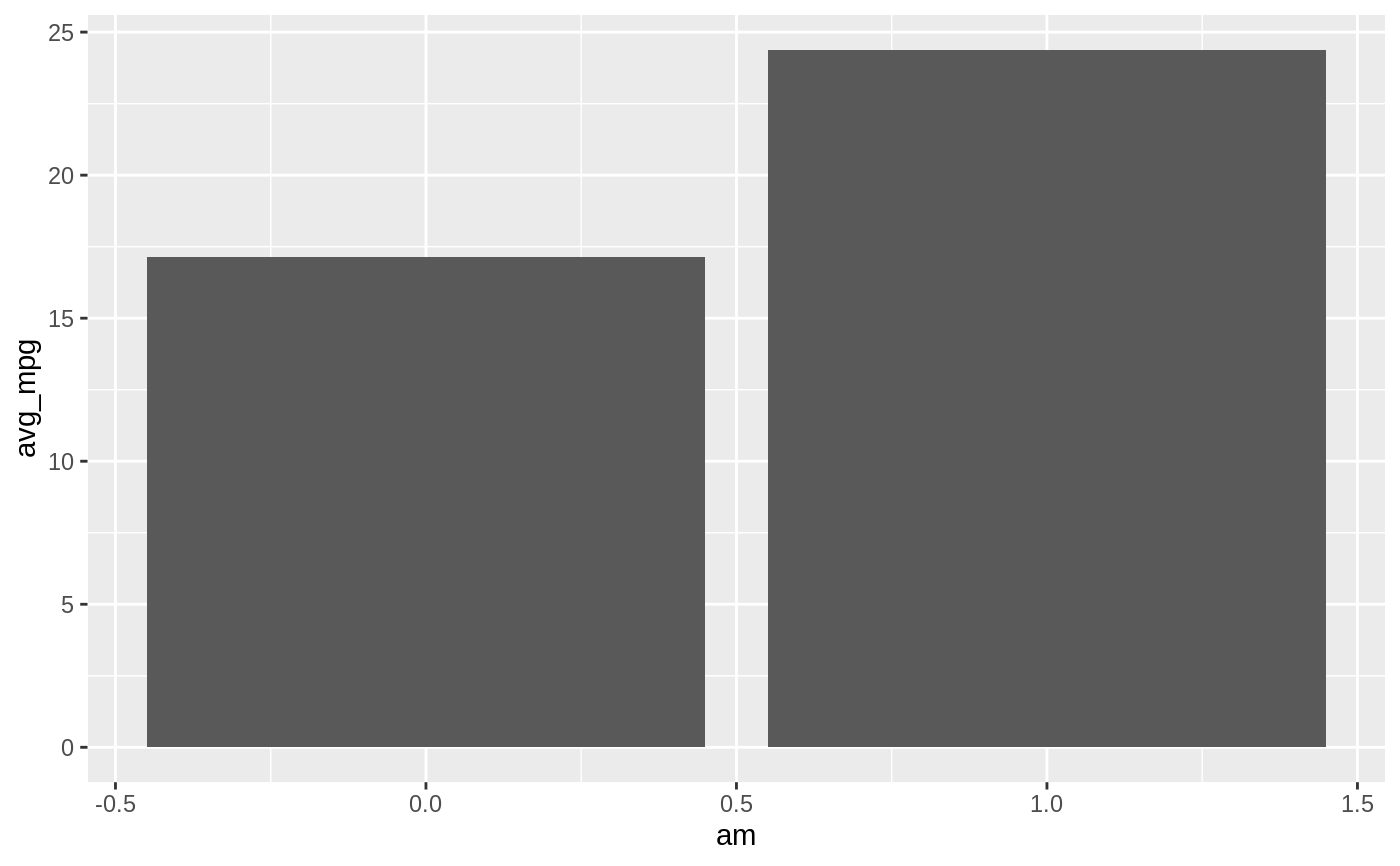
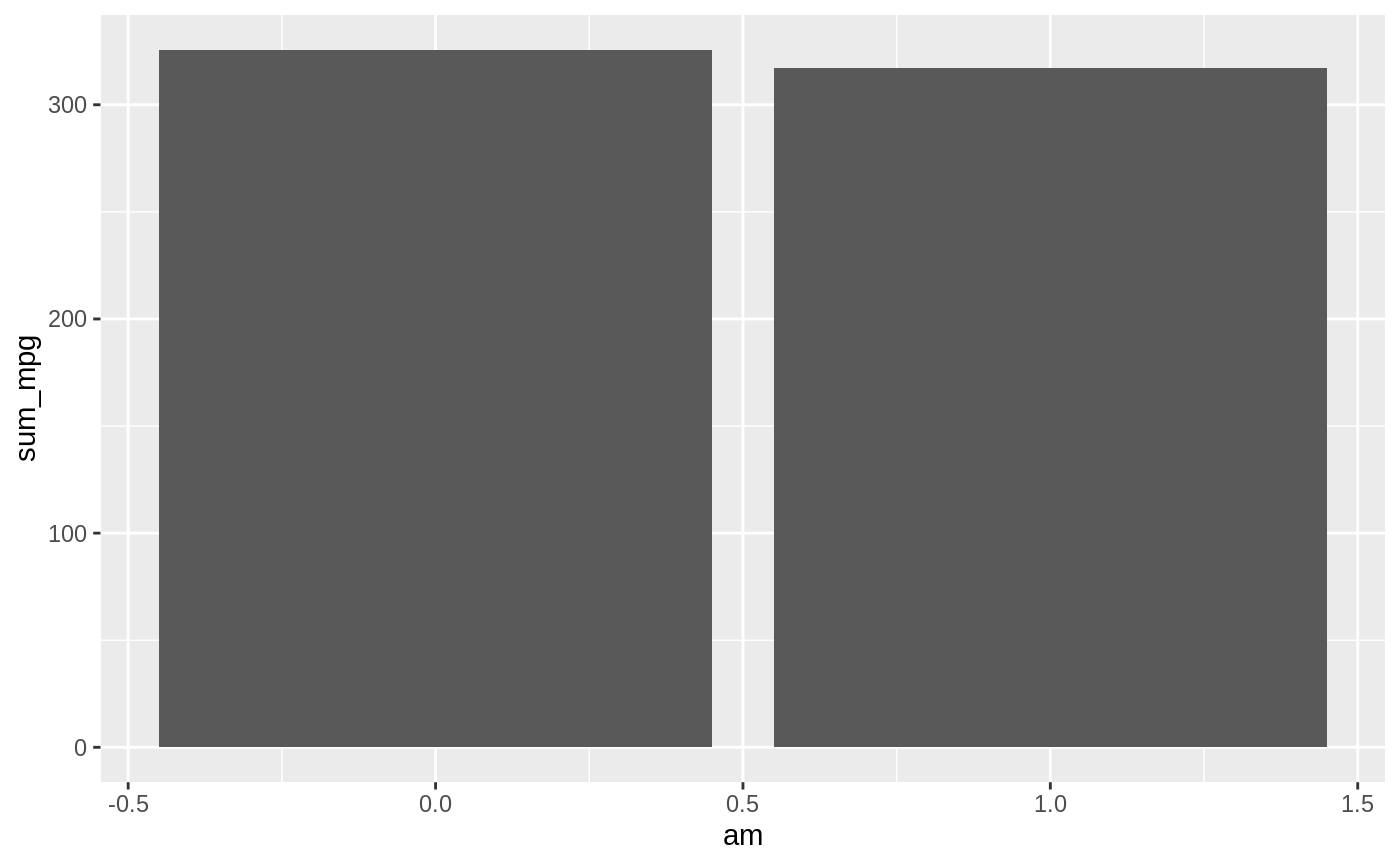
 # Returns the average and sum of mpg per am
db_mtcars |>
dbplot_bar(am, avg_mpg = mean(mpg), sum_mpg = sum(mpg))
#> $avg_mpg
# Returns the average and sum of mpg per am
db_mtcars |>
dbplot_bar(am, avg_mpg = mean(mpg), sum_mpg = sum(mpg))
#> $avg_mpg
 #>
#> $sum_mpg
#>
#> $sum_mpg
 #>
dbDisconnect(con)
# }
#>
dbDisconnect(con)
# }